Income disequilibrium
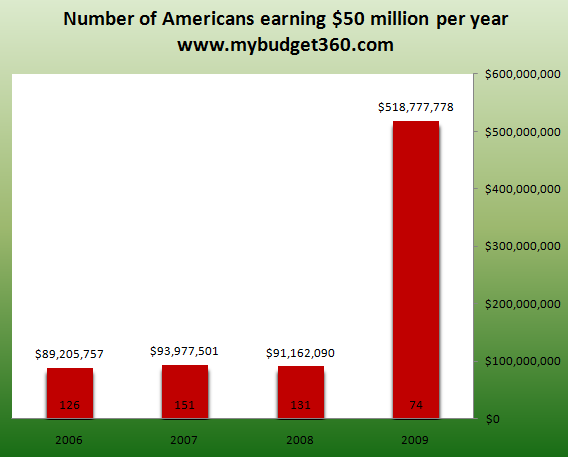
The top 74 Americans earned an average of $518 million in the economic troubling year of 2009. Top 1 percent earned 14 percent of all earnings in 2009 versus 11 percent in 1989.
The disappearing middle class in the United States is a troubling consequence of the culmination of economic and political policies of many decades. There is a sense, and probably why so much frustration is out in the country, that the once comfortable life of being middle class is slowly slipping through our hands. The American public senses something is amiss with the economic system and clearly is not happy. When we look at income data from the Social Security Administration records, we realize that even in years that Americans have suffered greatly, the wealthiest in our country actually became a lot richer. The jump is incredible and begs the question that in a year where millions lost their jobs and witnessed collapsing home values how was it possible for a few to make hundreds of millions of dollars and sometimes billions of dollars? Let us first examine the income data for this elite group.
Social Security provides data on taxes paid by each income group. This is a great way to view the cutoff points for many Americans. The top bracket is reserved for those making $50 million a year or more:
Source: Social Security Administration
I find the above data fascinating. In 2008 we had 131 Americans earning $50 million or more and the average amount earned was $91 million. In 2009 however the group shrank to 74 and the average was up to $518 million. How someone could earn half a billion dollars in this economic calamity begs the question of how people are earning their money. We know, that there are many hedge funds on Wall Street, many as opaque as night that makes money betting on the failure of U.S. economy. A few well known hedge funders have come out with their giant bets on the subprime industry and made billions of dollars. Yet this bet was not free or purely free market play. On the other side of the bet, the companies and banks that should have failed were bailed out by taxpayers. In other words, this was a rigged system that had a societal cost and those that won big really provided no service to the country. In fact, they were the fuel that kept the housing bubble going longer and longer because someone was willing to bet on the failure of Americans. Ironically it is the failed American public that is paying the big bet payoff.
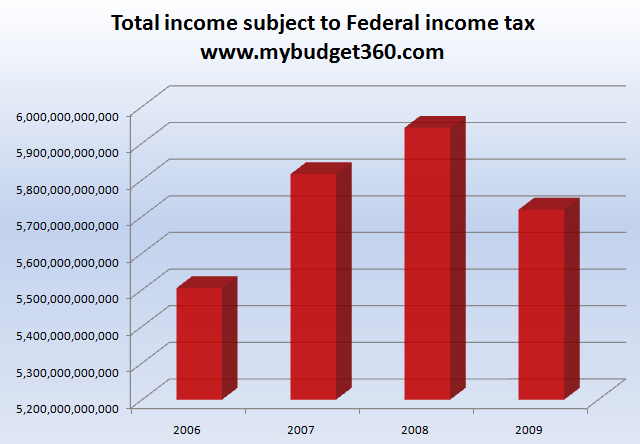
The above chart is only one corner of our economy with major problems. Many of the top earners in the U.S. now have little to do with producing anything of value. Many are simply glorified gamblers and manipulators of government policy. Think of the bailouts of Goldman Sachs through AIG. This didn’t need to occur yet it cost taxpayers billions of dollars for this move. The rich are getting richer but it is at the cost of the working and middle class. It would be one thing if the economic pie was growing for everyone else. It isn’t. How so? Just look at total wage compensation for the following years:
So overall, the amount subject to Federal income taxes in 2009 fell for the aggregate of the country yet shot up for the wealthiest in the country. It would be one thing if this was increasing and was increasing across the middle class. To the contrary, over the past decade wages for middle class families have remained stagnant and the latest Census data shows that the average median household income in the U.S. is $50,000 and that is a drop of $2,000 from the previous year.
The last time we saw this kind of income inequality was in the year that brought on the Great Depression. Yet after the crash of 1929 the rampant embezzlement from Wall Street was reigned in to a certain degree. Today, that massive fraud not only continues but rewards those at the top at the expense of all others. American worker productivity has gone up over the last decade but wages have not. Companies say they operate in a free market but they don’t. China artificially keeps its currency low and U.S. policymakers complain but what can you do to your largest creditor that allows you to finance your new plutocracy? The public is starting to follow the money and not the rhetoric.
Here is an interesting break down of where things have gone:
2009
Top 1 percent: Begins at incomes greater than $200,000
Total earnings share of all country: 14%
1989
Top 1 percent: Begins at incomes greater than $100,000
Total earnings share of all country: 11%
The above is crucial because it shows the growing plutocracy in the country. I would go further back but the data on the Social Security site only goes to 1989. If we go further back the inequality only grows. The top 1 percent in 2009 earned 14 percent of all income (and this is only the income that is subject to Federal taxes but we know with the multitude of loopholes, not all is subject to pay or even that the government knows about).
Unless something is done to address the flaws in the system, we are going to see that the number one export provide by the United States is our middle class.


0 Comments:
Post a Comment
<< Home